Category Archive Blog

Most dating apps are not great guardians of user data

The organization studied 25 apps and labeled 22 of them ” Privacy Not Included” — the lowest grade in Mozilla’s parlance. Mozilla only gave Queer-owned and operated Lex a positive review, with Harmony and Happn getting a passable rating. Dating apps are not following great privacy practices and are collecting more data than ever in order to woo Gen Z users, a new study by Mozilla pointed out. Researchers reviewed dating apps in terms of privacy in 2021. In the latest report, they noted that dating apps have become more data-hungry and intrusive.

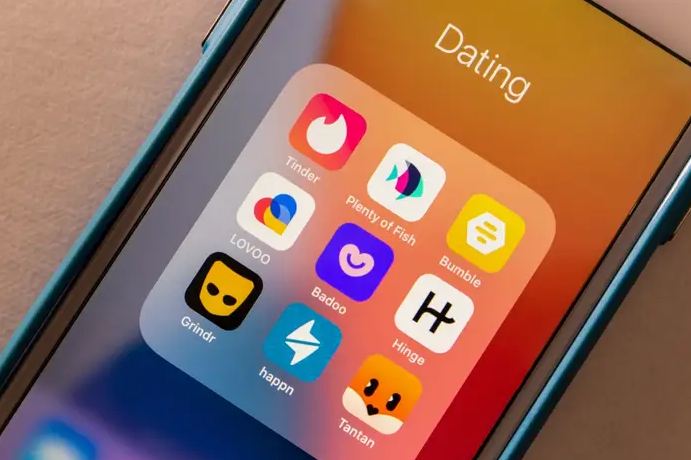
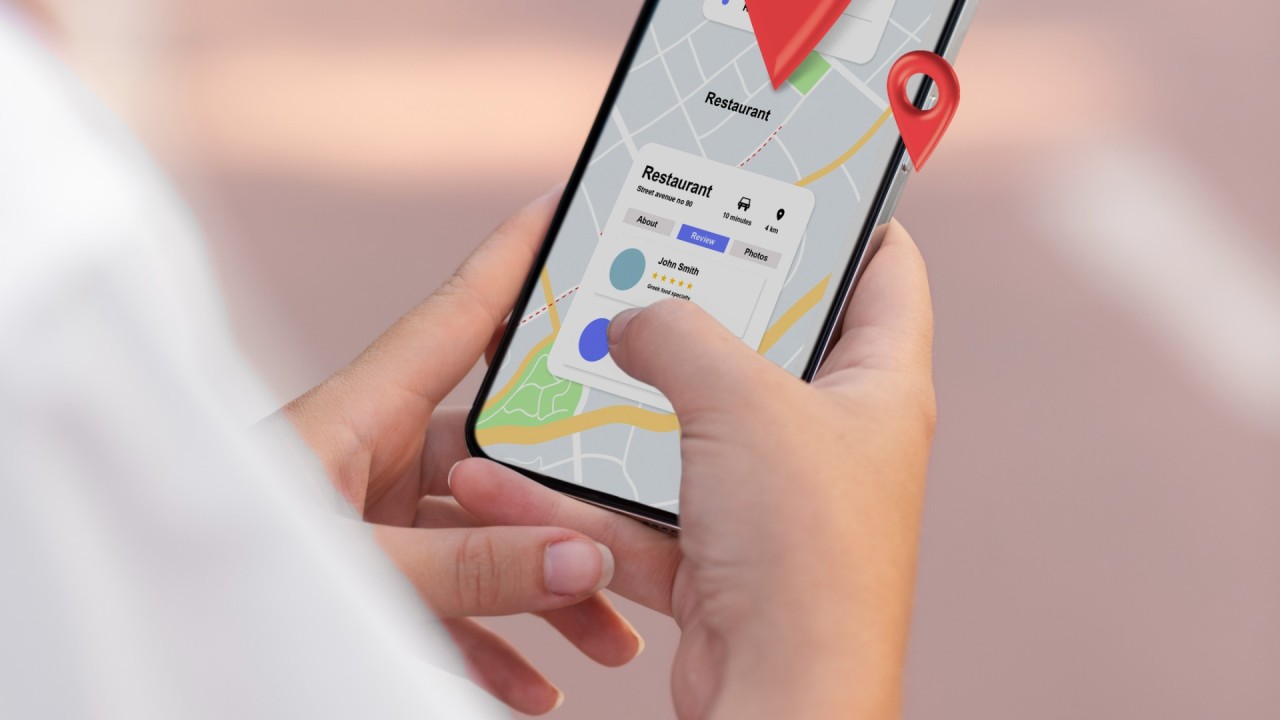
The report noted that the majority of apps, including Hinge, Tinder, OkCupid, Match, Plenty of Fish, BLK and BlackPeopleMeet, had precise geolocation from users. Apps like Hinge collect location data in the background when the app is not in use. “The collection of your geolocation may occur in the background even when you aren’t using the services if the permission you gave us expressly permits such collection. If you decline permission for us to collect your precise geolocation, we will not collect it, and our services that rely on precise geolocation may not be available to you,” Hinge’s policy. Mozilla said 80% of the apps may share or sell your personal data for advertising purposes. The report noted that apps like Bumble have murky privacy clauses that might sell your data to advertisers. “We use services that help improve marketing campaigns . . . Under certain privacy laws, this may be considered selling or sharing your personal information with our marketing partners,” an in-app popup says, as noted by Mozilla. Dating apps claim that they collect a significant amount of data to find better matches for users. However, if that data ends up with data brokers, there are grave consequences.

Last year, The Washington Post reported that a U.S.-based Catholic group bought data from Grindr to monitor some members. As per data from analytics firm data.ai, dating app downloads are slowing down. Separately, data from Pew Research published last year suggests that only three in 10 adults have ever used a dating site or an app — a figure that has stayed the same since 2019. Last month, The New York Times published a report noting that dating app giants Match Group and Bumble have lost more than $40 billion in market value since 2021. Companies are now looking toward new ways to engage potential daters, including experimenting with AI-powered features. Match Group already said during its Q3 2024 earnings this year that it plans to leverage AI. In March, Platformer reported that Grindr plans to introduce an AI chatbot that could engage in sexually explicit language.

Earlier this year, Mozilla also evaluated a bunch of AI bots that could act as a romantic partner and found some serious concerns about security and data sharing practices of these bots. Mozilla said that apps already use AI to match algorithms. With the onset of generative AI, researchers are not confident that dating apps will have enough protections for user privacy. Mozilla privacy researcher Misha Rykov said that, as dating apps collect more data, they have a duty to protect that data from being exploited. “To forge stronger matches users have to write compelling profiles, fill out numerous interest and personality surveys and charm matches, share pictures and videos — the whole experience is heavily dependent on how much information people share. By this virtue, dating apps must protect this data from exploitation,” he noted.

Monitor And Optimize Google Core Web Vitals

Google’s Core Web Vitals initiative has increased the attention website owners need to pay to user experience. You can now more easily see when users have poor experiences on your website, and poor UX also has a bigger impact on SEO. That means you need to test your website to identify optimizations. Beyond that, monitoring ensures that you can stay ahead of your Core Web Vitals scores for the long term. Let’s find out how to work with different types of Core Web Vitals data and how monitoring can help you gain a deeper insight into user experiences and help you optimize them.

What Are Core Web Vitals? There are three web vitals metrics Google uses to measure different aspects of website performance: 1. Largest Contentful Paint (LCP), metric is the closest thing to a traditional load time measurement. However, LCP doesn’t track a purely technical page load milestone like the JavaScript Load Event. Instead, it focuses on what the user can see by measuring how soon after opening a page, the largest content element on the page appears. The faster the LCP happens, the better, and Google rates a passing LCP score below 2.5 seconds. 2. Cumulative Layout Shift (CLS), is a bit of an odd metric, as it doesn’t measure how fast something happens. Instead, it looks at how stable the page layout is once the page starts loading. Layout shifts mean that content moves around, disorienting the user and potentially causing accidental clicks on the wrong UI element. The CLS score is calculated by looking at how far an element moved and how big the element is. Aim for a score below 0.1 to get a good rating from Google. 3. Interaction to Next Paint (INP), even websites that load quickly often frustrate users when interactions with the page feel sluggish. That’s why Interaction to Next Paint measures how long the page remains frozen after user interaction with no visual updates. Page interactions should feel practically instant, so Google recommends an INP score below 200 milliseconds. You’ll often see different page speed metrics reported by different tools and data sources, so it’s important to understand the differences. We’ve published a whole article just about that, but here’s the high-level breakdown along with the pros and cons of each one: 1. Synthetic Tests, these tests are run on-demand in a controlled lab environment in a fixed location with a fixed network and device speed. They can produce very detailed reports and recommendations. 2. Real User Monitoring (RUM), this data tells you how fast your website is for your actual visitors. That means you need to install an analytics script to collect it, and the reporting that’s available is less detailed than for lab tests. 3. CrUX Data, Google collects from Chrome users as part of the Chrome User Experience Report (CrUX) and uses it as a ranking signal. It’s available for every website with enough traffic, but since it covers a 28-day rolling window, it takes a while for changes on your website to be reflected here. It also doesn’t include any debug data to help you optimize your metrics.

Running tests continuously has a few advantages over ad-hoc tests. Most importantly, continuous testing triggers alerts whenever a new issue appears on your website, allowing you to start fixing them right away. You’ll also have access to historical data, allowing you to see exactly when a regression occurred and letting you compare test results before and after to see what changed. As this process runs, it feeds data into the detailed dashboard with historical Core Web Vitals data. You can monitor a number of pages on your website or track the speed of your competition to make sure you stay ahead. Synthetic tests are great for super-detailed reporting of your page load time. However, other aspects of user experience, like layout shifts and slow interactions, heavily depend on how real users use your website. So, it’s worth setting up real user monitoring with a tool like DebugBear. To monitor real user web vitals, you’ll need to install an analytics snippet that collects this data on your website. Once that’s done, you’ll be able to see data for all three Core Web Vitals metrics across your entire website.